Market Analysis · October 8, 2026
The 2026 FDIC Deposit Data Overstates Local Growth. What It Means for 2027 Deposit Strategy
By Tom McDermott, Managing Partner, Inver Consulting Group
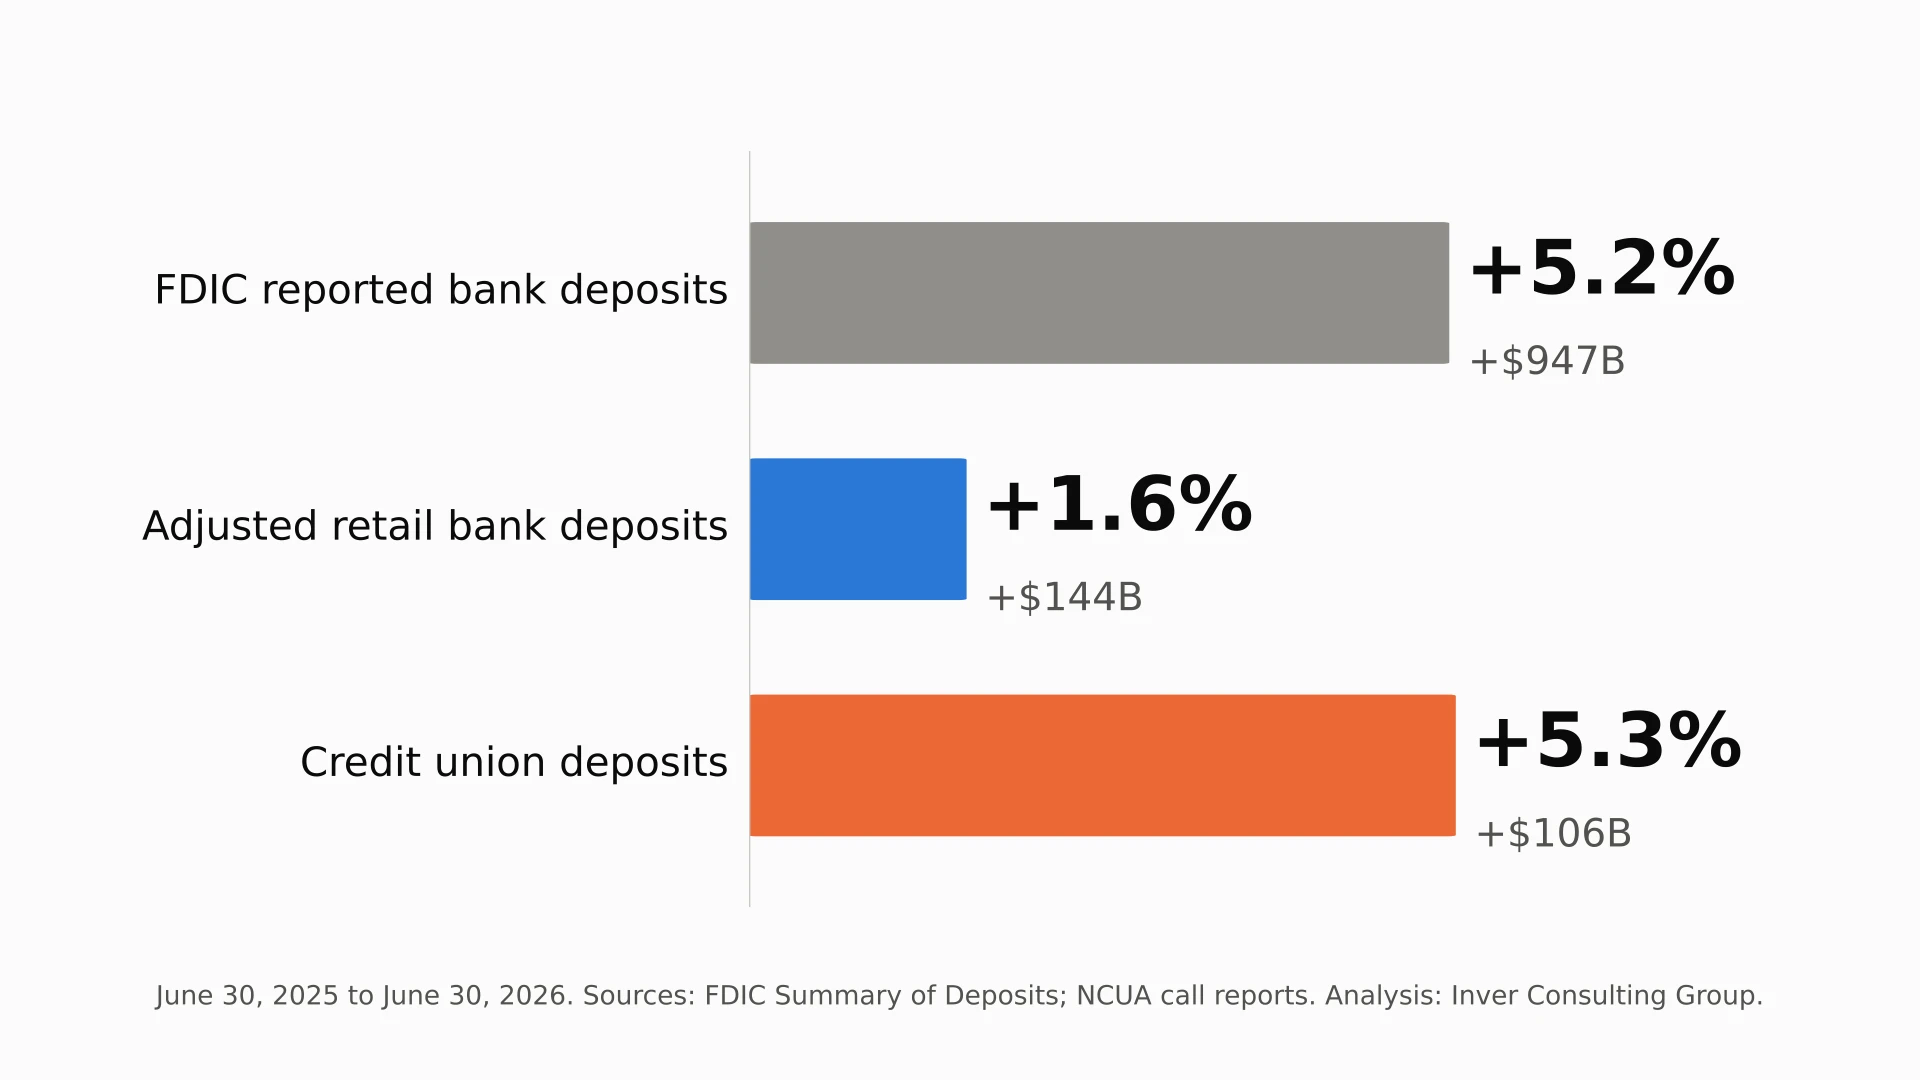
The 2026 deposit data tells a different story than the headline. Most of the reported growth never reached a local branch market. Credit unions took a share of local growth more than twice their size. Once mergers are separated from true closures, the branch network actually grew. This article walks through what the FDIC and NCUA data shows by market type, what really happened to branches, and what the September rate hike means for deposit growth and deposit costs in 2027. If you are building your 2027 strategic plan, start with these numbers.
Most reported growth never reached a local market
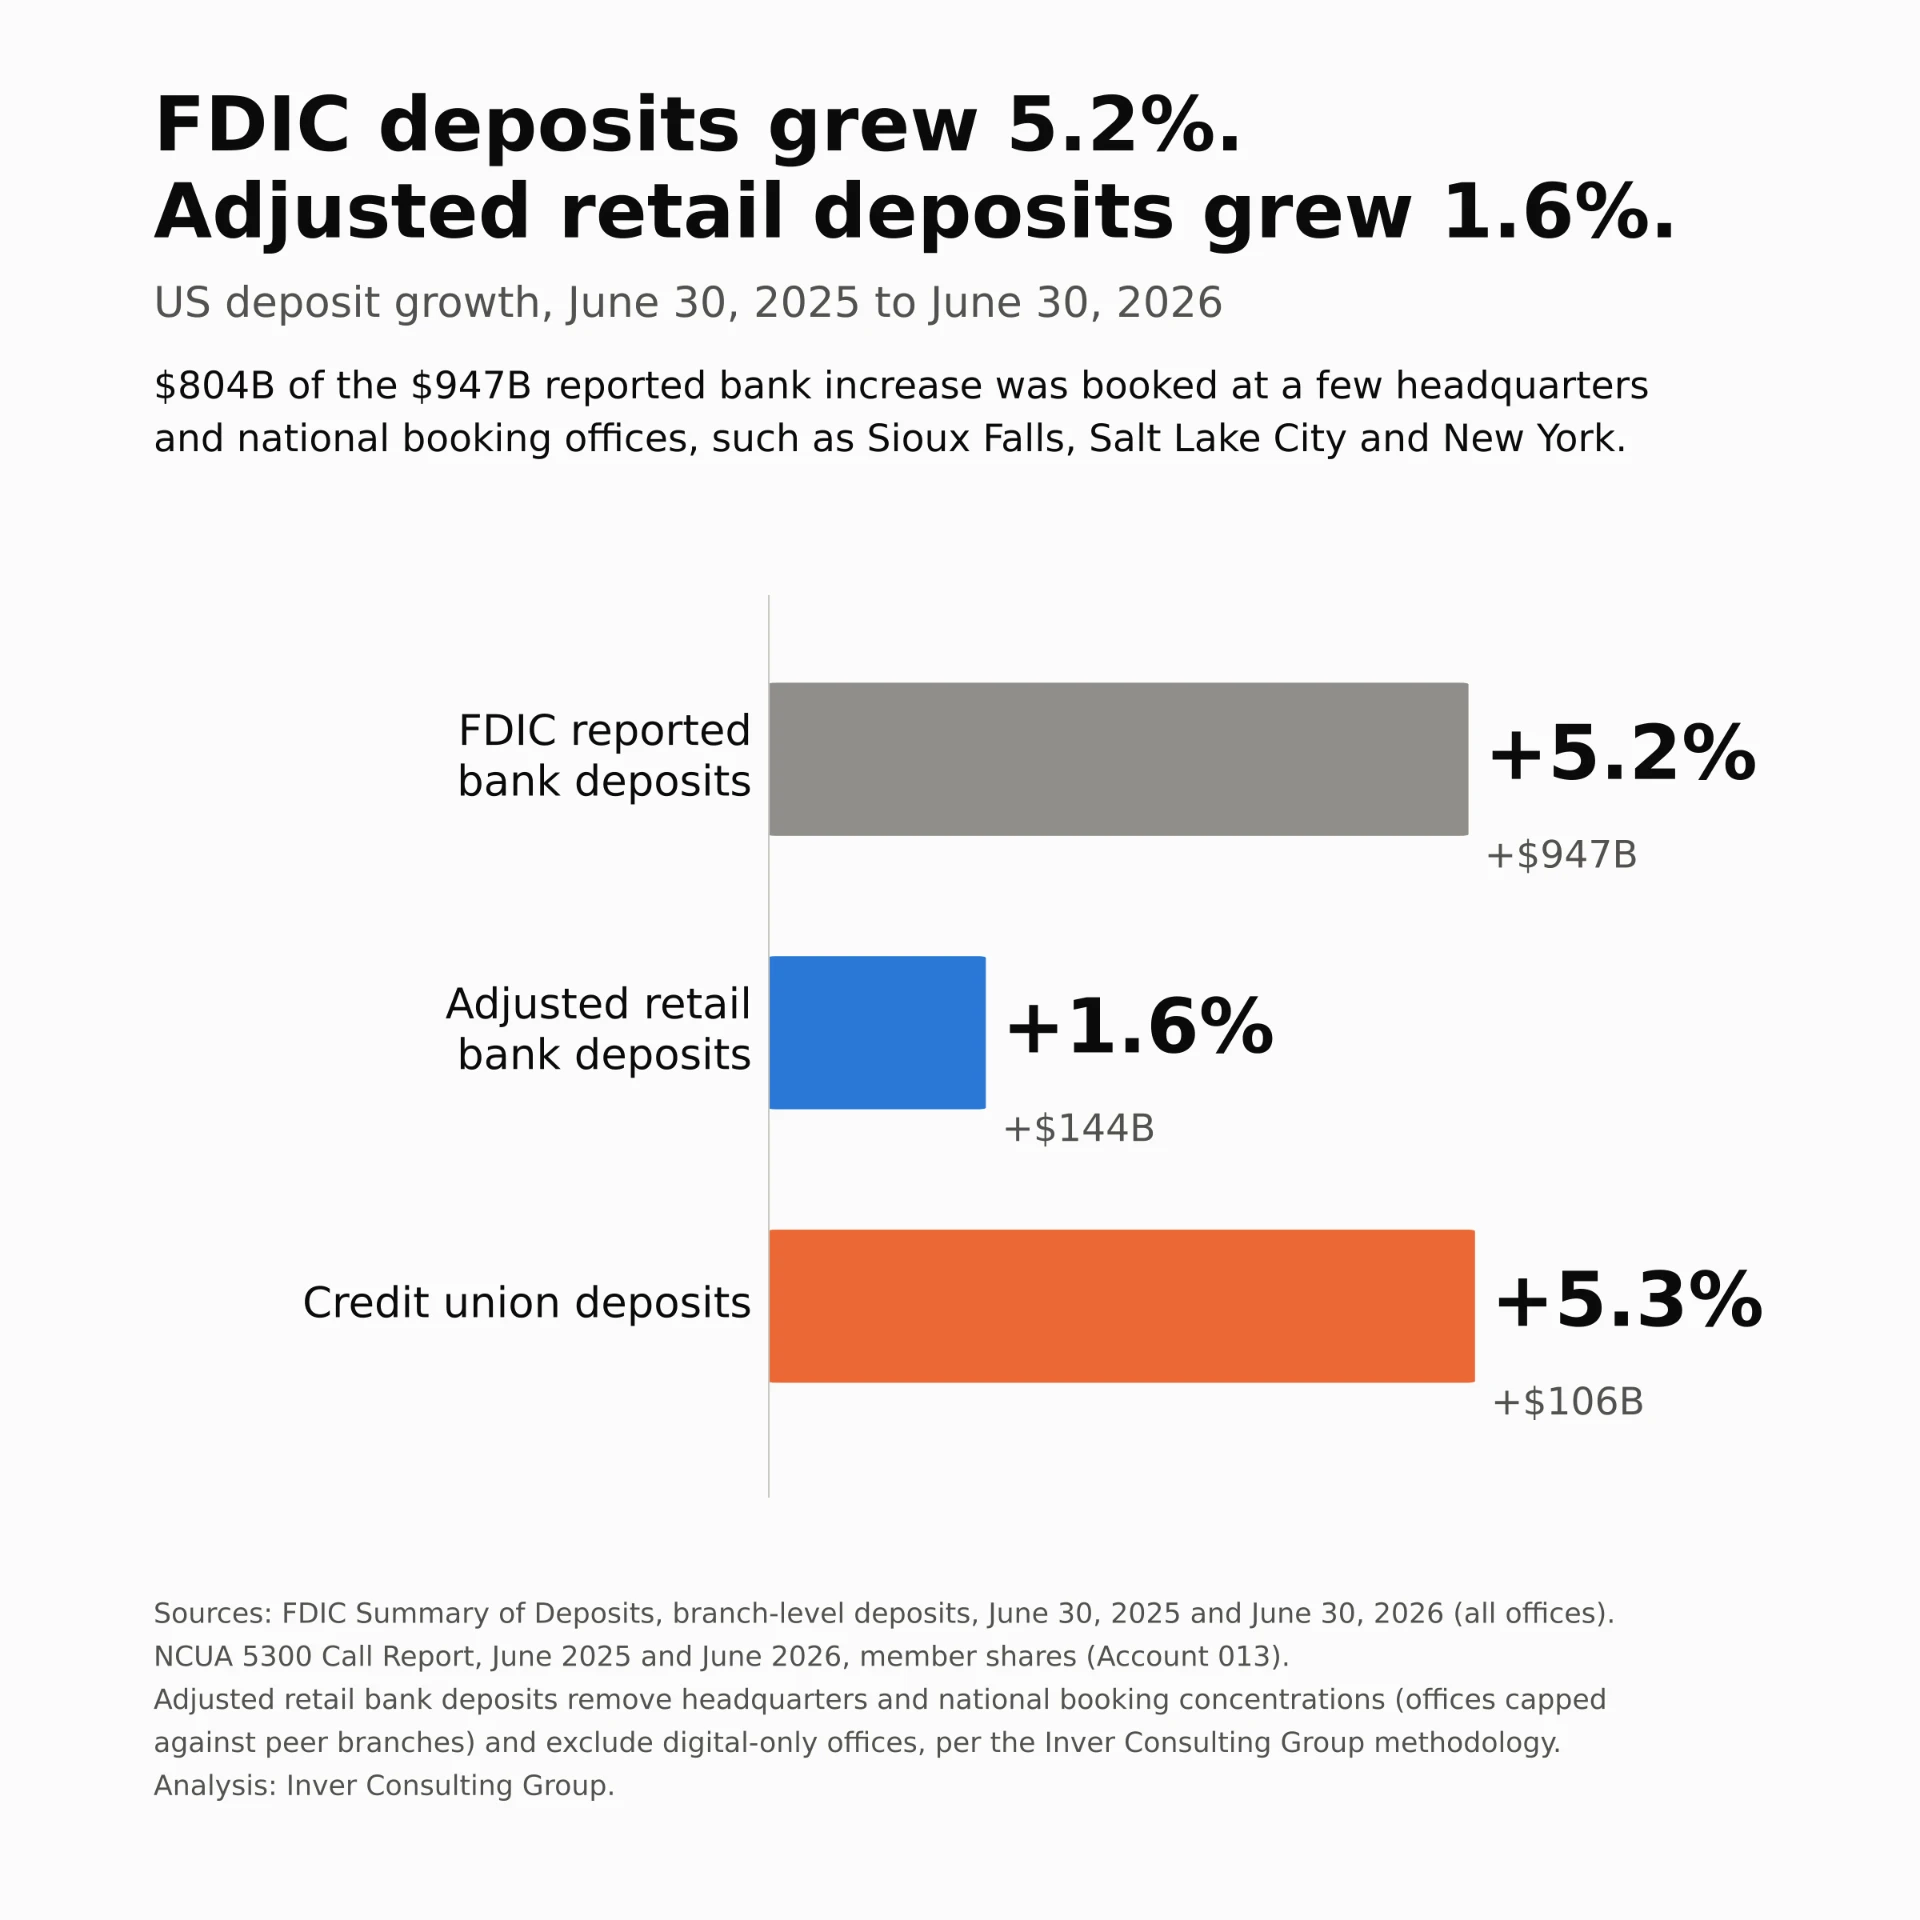
The FDIC Summary of Deposits shows US bank deposits rising from $18.10 trillion to $19.05 trillion between June 30, 2025 and June 30, 2026, an increase of $947 billion, or 5.2%.
Most of that money was not retail deposit growth in local markets. Banks book national deposits (online accounts, wealth management sweeps, corporate balances) at a small number of headquarters and charter offices. After removing those concentrations and digital-only offices, adjusted retail deposits grew $144 billion, or 1.6%.
Growth sped up from 2025, but almost all of the acceleration was booked outside local markets: FDIC deposits went from 4.0% to 5.2%, adjusted retail from 1.3% to 1.6%.
The remaining $804 billion was booked at offices like these (growth from June 2025 to June 2026):
- Wells Fargo, Sioux Falls, SD: +$117 billion
- Citibank main office, Sioux Falls, SD: +$115 billion
- Morgan Stanley Bank main office, Salt Lake City, UT: +$76 billion
- Goldman Sachs Bank USA main office, New York, NY: +$53 billion
- Capital One digital office, Wilmington, DE: +$39 billion
Ten banks account for 76% of the booked increase. Measured against adjusted retail deposits, the 5.2% headline overstates local market growth by more than three times.
Credit unions captured 43% of retail deposit growth
Credit unions held 18.6% of US retail deposits in June 2025 (banks after adjustment plus credit unions). They captured 42.6% of the growth over the following year. Credit union member shares grew $106 billion, or 5.3%, against 1.6% for adjusted retail bank deposits.
The growth is broad, not driven by a few giants. Excluding Navy Federal, the largest credit union, credit union growth was still 5.1%.
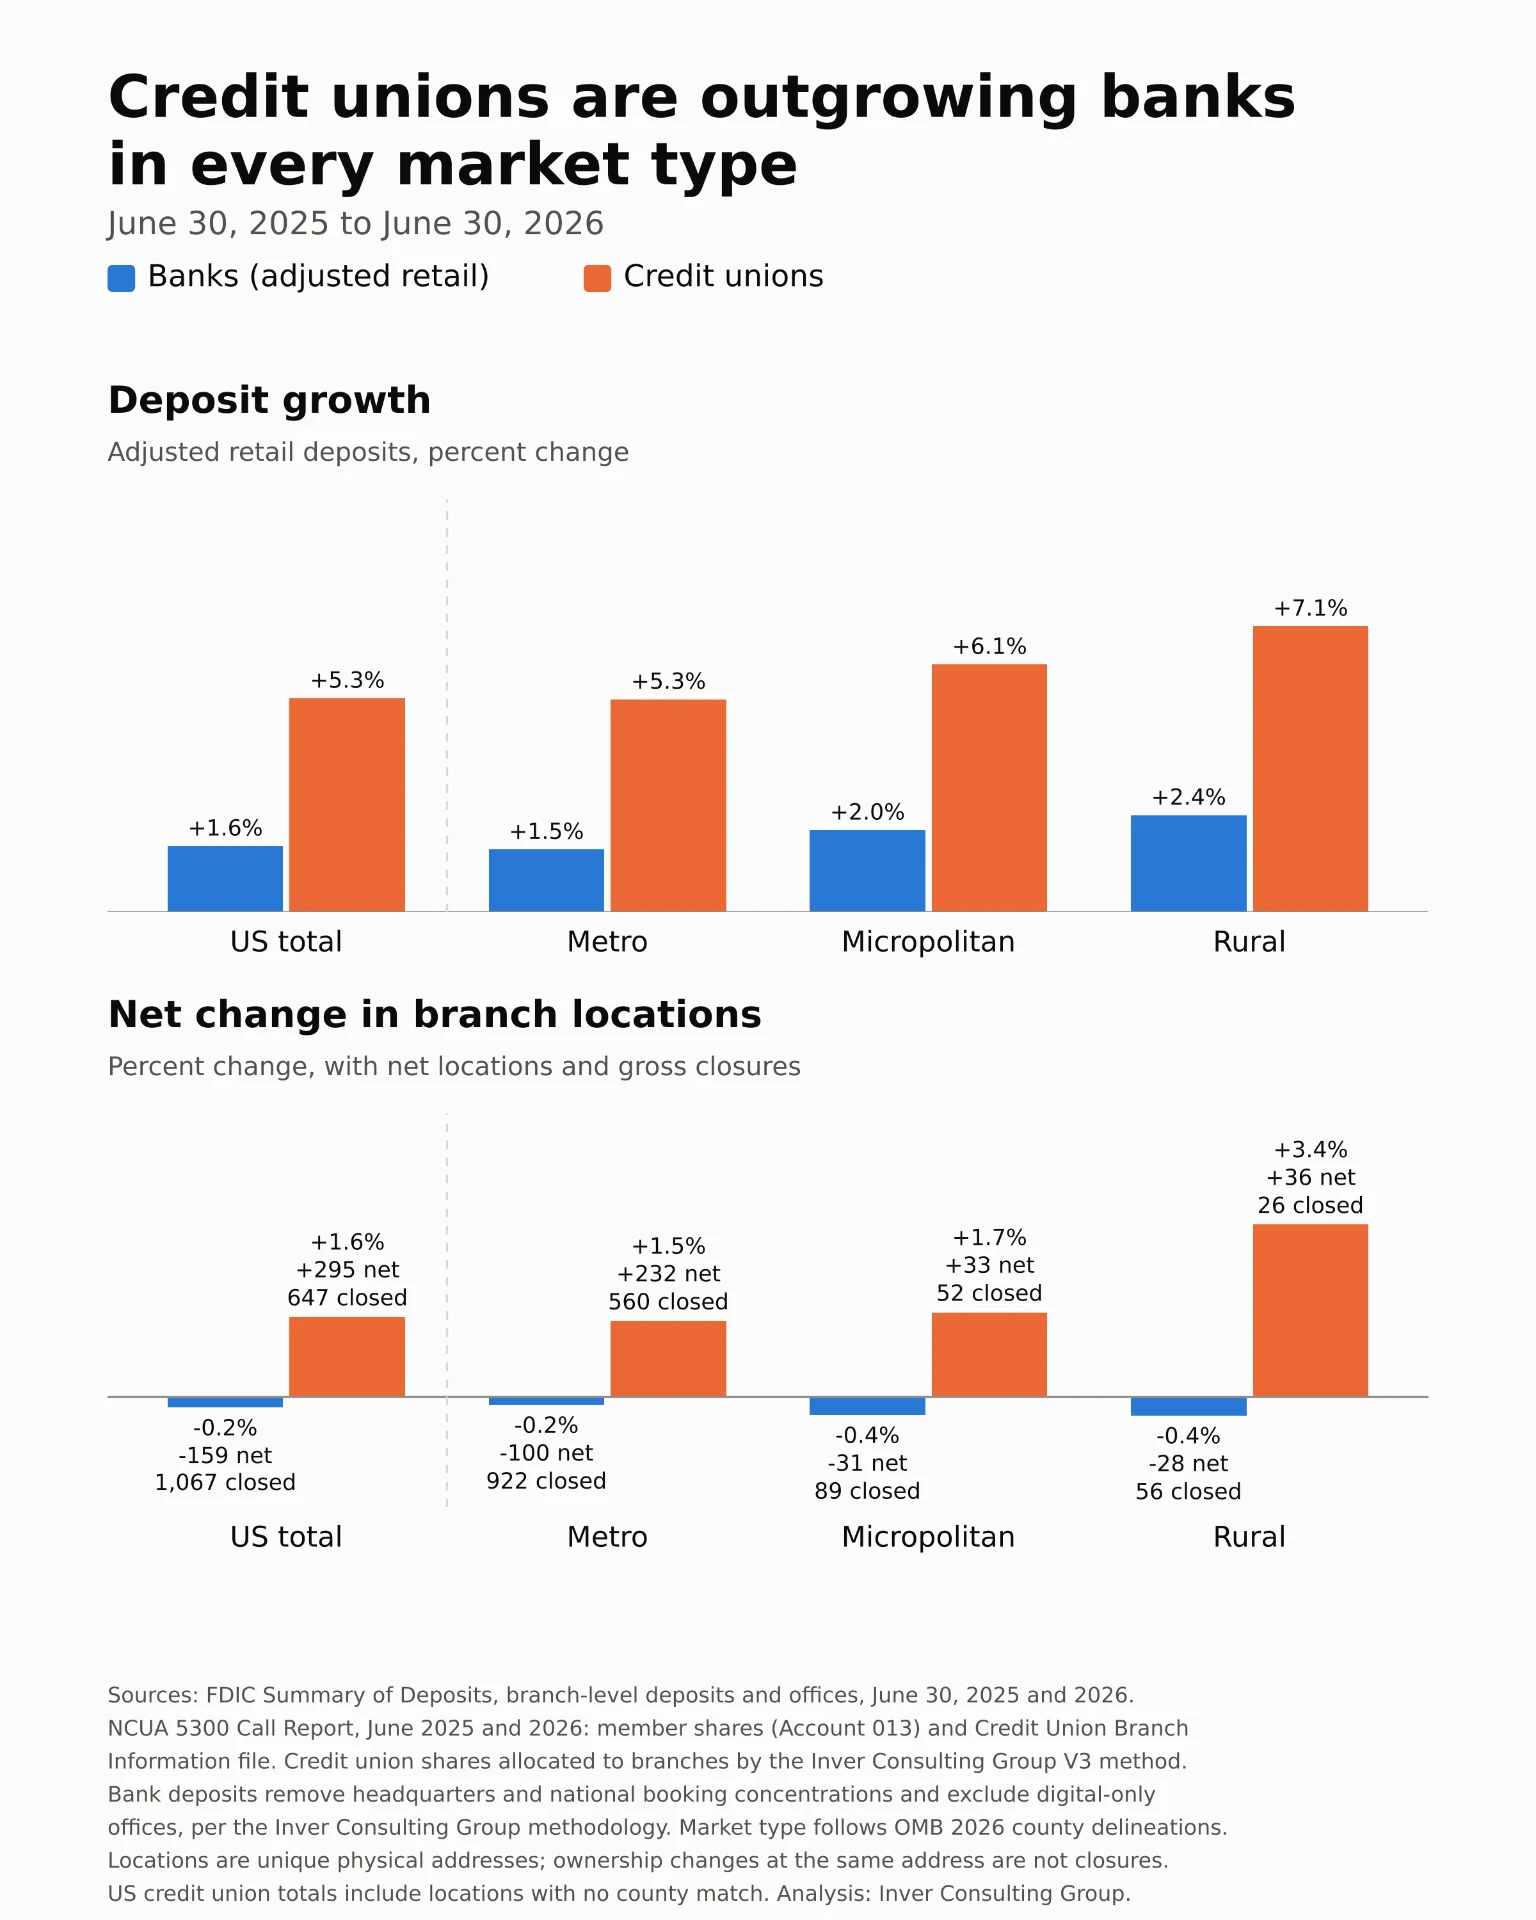
Branch networks: banks lost 159 locations, credit unions added 295
Most branch closure counts compare last year’s list to this year’s and call every missing name a closure. Matching locations by street address tells a different story (June 2025 to June 2026):
- Banks closed 1,067 branches and opened 984, for a net loss of 159 locations (0.2%).
- Credit unions closed 647 and opened 869, for a net gain of 295 locations (1.6%).
- Together, the US has 136 more bank and credit union branch locations than a year ago.
- 2,339 bank branches and 472 credit union branches changed owners at the same address through mergers. They are not closures.
- 73 bank branches, holding $6.8 billion in deposits in 2025, now operate as credit union branches at the same address.
Banks targeted and closed lower deposit branches. The median closed bank branch held $52.9 million in deposits, against $82.1 million for all bank branches.
The largest net bank addition markets were in Dallas-Fort Worth (+29), Atlanta (+18), Miami (+14) and Charlotte (+11). The largest net reductions were in New York (-45), Boston (-18), Chicago (-17), San Francisco (-12) and Seattle (-12).
What the September 2026 rate hike means for 2027 deposits
The Federal Reserve raised its target range by 25 basis points to 3.75% to 4.00% on September 17, 2026, its first increase since July 2023. The Fed’s September projections show one more increase in 2026 and a flat rate through 2027.
History says a small hike barely changes how fast deposits grow. Large, fast hiking cycles are the exception.
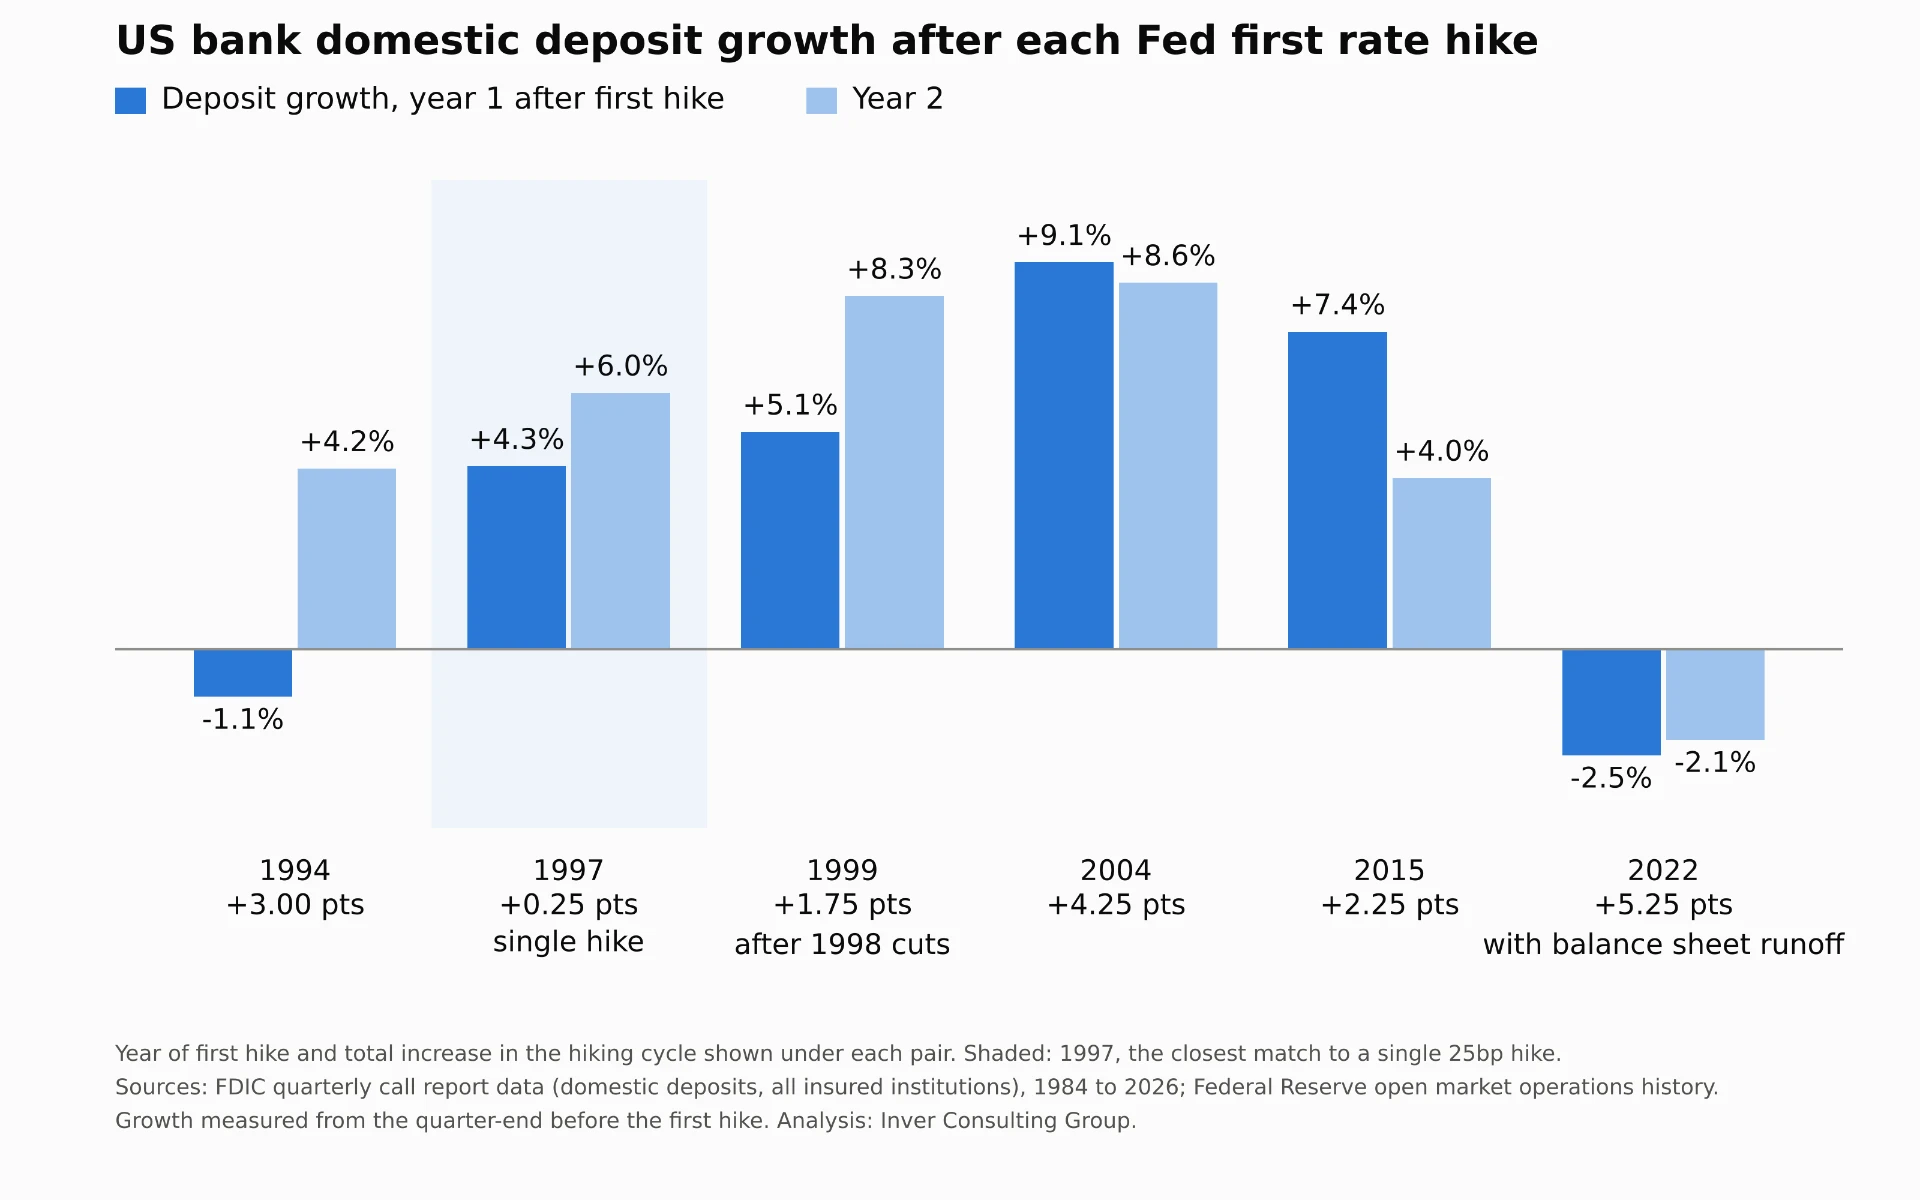
What changes every time is cost and mix. After the 1999 and 2004 first hikes, the average cost of domestic deposits rose 58 and 108 basis points within two years, and non interest-bearing balances lost share. Today, non interest-bearing deposits are 21.2% of domestic deposits and the average deposit cost is 1.82%.
Our 2027 deposit growth base case:
- Industry bank deposit growth of about 4%, down from 5.4% in the year to June 2026.
- Adjusted retail bank deposit growth of about 1%, down from 1.6%.
- Credit union deposit growth of about 4.5%, down from 5.3%, so credit unions keep taking a large share of local deposit growth.
- Higher deposit costs and a further shift from non interest-bearing to interest-bearing accounts.
One 25 basis point hike will barely dent 2027 deposit growth. It will change what those deposits cost.
Get one free deposit market snapshot
We hope you found this analysis helpful during strategic planning season. Pick one market and we will send a one-page snapshot showing FDIC reported deposit growth against adjusted retail growth, your share change, credit union growth and share in that market. Email Tom at tmcdermott@inverconsultinggroup.com or call (206) 890-1901.
Methodology and sources
Bank deposits and branches: FDIC Summary of Deposits, branch-level data as of June 30, 2025 and June 30, 2026. Physical offices only.
Adjusted retail deposits: Inver Consulting Group’s retail screen caps headquarters and national booking offices against the bank’s peer branches in the same market and excludes digital-only offices.
Credit union deposits and branches: NCUA call report data, June 2025 and June 2026, member shares and the Credit Union Branch Information file. NCUA does not report deposits by branch, so Inver Consulting Group allocates each credit union’s shares to its branches using a market-based method that weights local bank branch productivity, population, deposits and GDP per capita, and market concentration.
Demographics: US Census Bureau county population estimates, 2024 and BEA county GDP, 2024.
Market types: Metro and micropolitan areas follow current OMB delineations by county; all other counties are rural.
Branch changes: Locations are matched by street address. A location that changed owner at the same address is counted as a merger, not a closure. A relocation by the same institution is not counted as a closure or opening.
Rate history: Federal Reserve open market operations, Federal Reserve archive, FOMC projections, September 16, 2026, and FDIC quarterly call report data, 1984 to 2026.
2027 estimates are Inver Consulting Group judgment based on these sources, not a forecast guarantee.